


User from time to time. IT specialist, the user of the different delivery food services. Middle class income group.
Case study: Domino's Pizza Australia
The Domino's Effect: The Unbelievable Potential of a Redesign Proposal for Domino's Australia's App!
User Research
Full-cycle Design Process
Metrics
AI
Using metrics based approach to improve the mobile application
At MadAppGang, being developers, we are pizza lovers to the core. We think mobile apps are the perfect way to make ordering pizza easier and more enjoyable, and frequently use the Domino's Pizza app.
Do you know Domino's Pizza?
It’s an impressive global business, the world's largest network of pizzerias in terms of turnover. The company is represented in more than 85 countries worldwide. Their recipe for success largely revolves around using cutting-edge technology to streamline operations, producing a top-notch pizza for a fair dinkum price. They even created their own environmentally friendly bike delivery fleet and introduced on-time cooking.
But what’s wrong with the app?
Each time we use the Domino's Pizza app we feel a bit let down because it doesn't reflect the technological prowess of Domino's as a company. We reckon the app could be improved. With a decade of experience under our belts, we're pretty confident about this. But why would anyone listen to us, just a small tech firm? Surely there are heaps of talented and innovative blokes and sheilas working at Domino's and maybe they designed it this way intentionally.
What can we propose?
Fortunately, there's a simpler path forward we can use to validate our hypothesis. We could employ modern UX research methods and prototyping to assess the results. The facts and figures won't fib. And the best bit is, we wouldn't need to develop an app for this. All of it could be accomplished on a shoestring budget. So, sit back, grab some popcorn (or a slice of pizza), and let's make it a good time.
Step 1. Understanding our goal
Our focus here is proving the necessity of these changes and measuring the effectiveness of our solution.
We'll go through a complete design cycle using various KPIs.

How to measure success?
Many different metrics can be used to measure design success. The main metrics categories cover:
- business and product, including retention, engagement, conversion, revenue, churn rate, and more
- user experience, including task success rate, time-on-task, system usability scale (SUS), net promoter score (NPS), and customer satisfaction (CSAT))
In this particular case, we don’t have access to business and product metrics, but we still can analyse customer satisfaction metrics. What else?
With usability testing of the existing app, separated into the main flows, we can:
- measure the time needed to complete tasks, and the satisfaction level of a particular flow
- ask for feedback or improvements for each flow
- check standard loyalty metrics like NPS and SUS

Step 2. Discover
At this stage, we want to understand our users as much as possible. To do this, we first have to understand who they are, how they use this application, and in what conditions. We also want to know their main goals and frequent pain points. It’s important to keep their demographic characteristics in mind.
Since we’re working on the Australian version of the Domino’s Pizza app, and there are numerous apps for other countries and they are very different from each other, it’s critical to our specific research to find users living in Australia so we can truly understand their behavioural patterns and make sure our findings are reliable.
The main output of the discover stage should be the list of confirmed assumptions about how to improve the app.
Our research plan
Analysis of the current mobile app (assess UX and UI, key user flows, consistency, accessibility, and so on)Usability testing and user interviews are expensive and time-consuming research tools, so it’s important to be well-prepared before you start. It’s better to have assumptions about your target audience and their possible pains and needs. Starting with an analysis of the current app, and its UI and UX, using heuristics and our expertise, we can make a few assumptions based on our findings. We can then check these in the user research phase.
Secondary researchUser feedback analysis is a powerful tool for redesign. We can go through App Store reviews, collect new assumptions, and explore insights.
User research (check and create new assumptions, get insights about user’s jobs, needs, and pains, and find specifics about Australian users)Interviews: Preferably with Australian users of delivery food services, ideally Domino's Pizza users. Observation/usability testing: This is the best opportunity to measure the effectiveness of our redesign. We can create usability testing research that includes survey elements to measure user satisfaction with some flows. We can give users tasks and measure the time spent on each. Surveys: We can use simple questionnaires to measure CSAT, NPS, and SUS metrics.
Analysis of the current app
Before analysis, we separated the app into its main flows to make it easier to find issues and measure specific metrics for each flow.
Flow 1
Entry to the app – Start delivery order
Flow 2
Browse products
Flow 3
Customise selected item
Flow 4
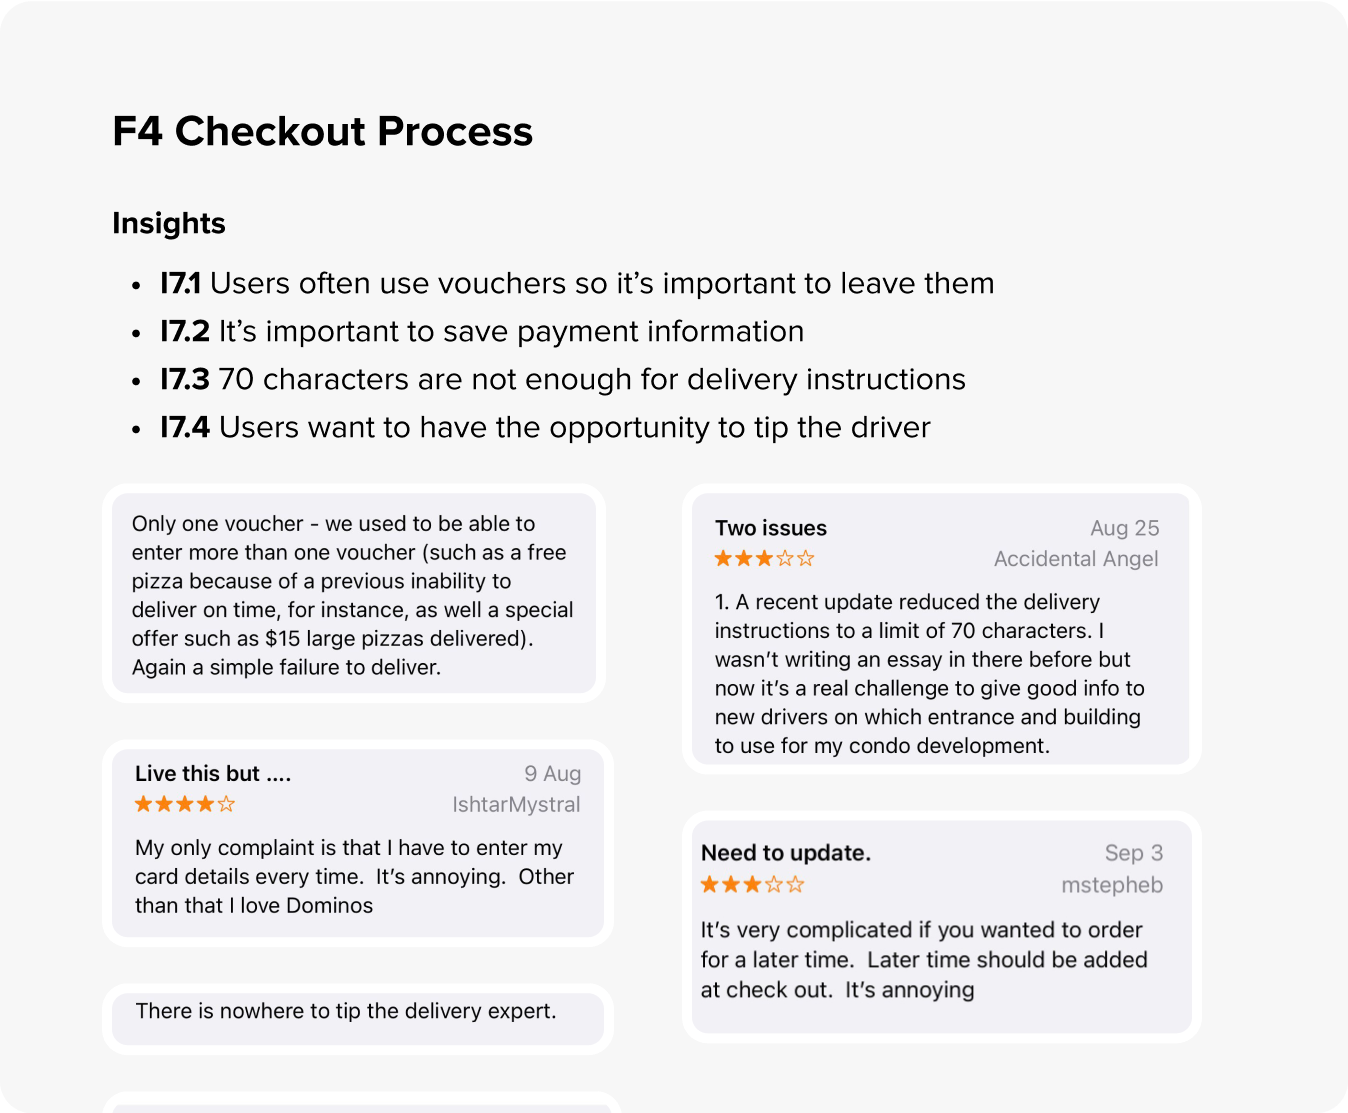
Checkout process
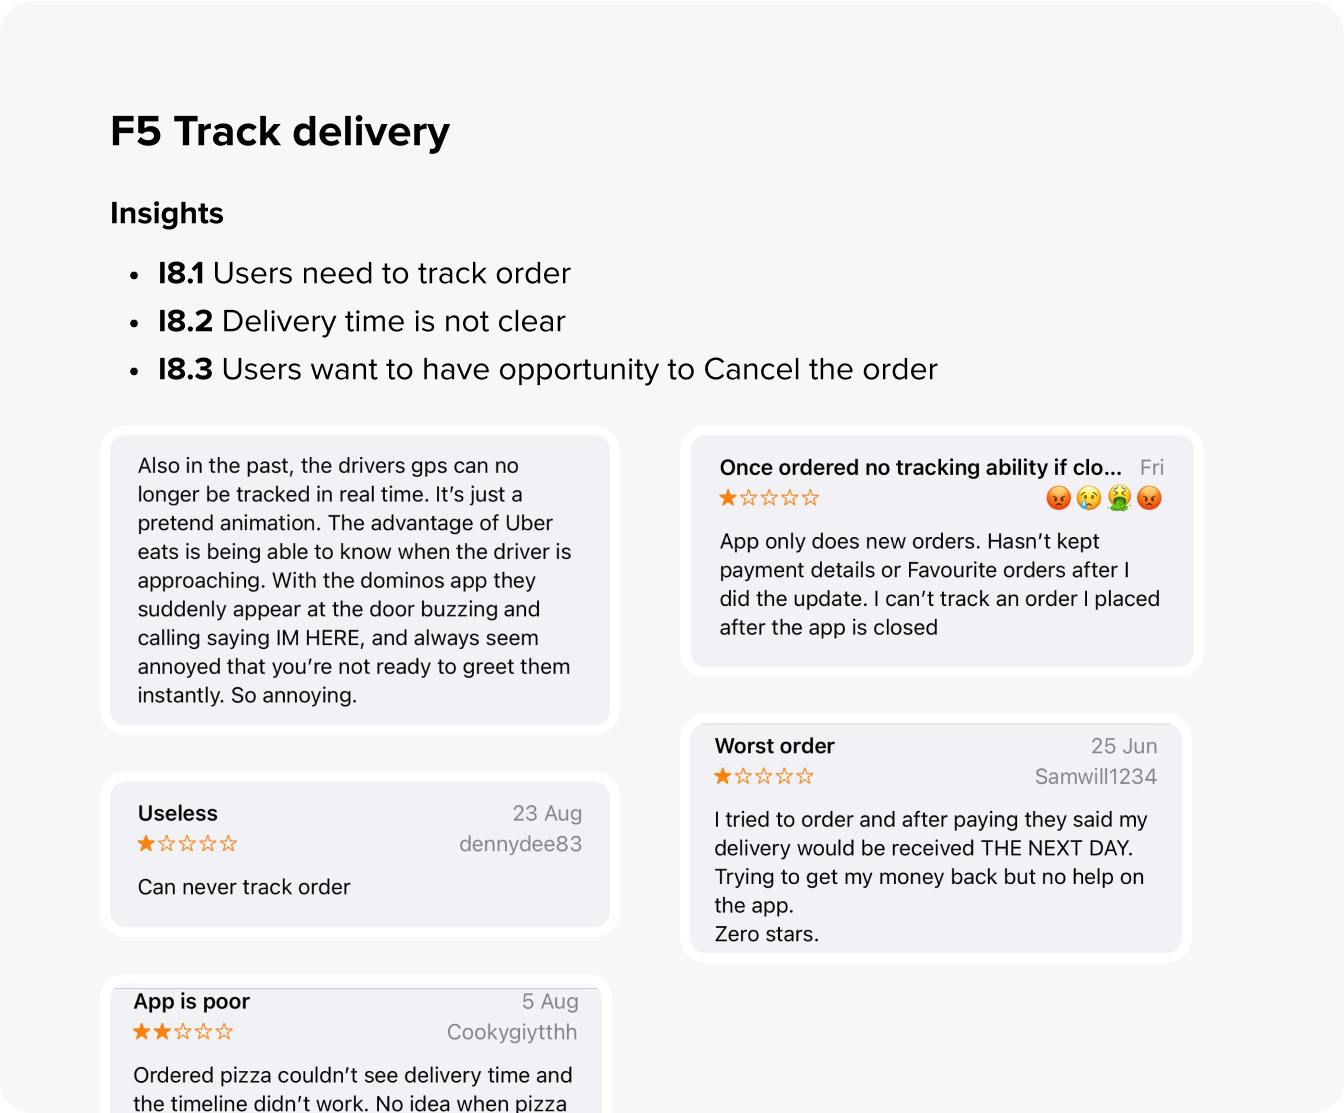
Flow 5
Track delivery
Analysis of the current app – Flow 1
Analysis of the current app – Full process
After a thorough analysis of the app's flows, we compiled a comprehensive list of assumptions regarding potential UX and UI issues that may hinder the user experience, rendering it confusing and ineffective.
By identifying these hypothetical concerns, we can proactively address them and improve the app’s overall usability and functionality, ensuring a seamless and satisfying user experience.
User feedback analysis
User feedback analysis is a powerful UX research tool. It’s also cheap and informative. We analysed App Store reviews and collated them according to the flows, and almost all of our assumptions were confirmed.
During feedback analysis, we found other frequent user complaints that were not included in any of our flows. For example, users need customer service and to have an opportunity to repeat their orders.
Repeat orders
Insights
- I5.4 It’s very important for users to have the opportunity to repeat their previous orders

Customer service
Insights
- I9.1 Users want to have the opportunity to contact customer service in case of the order problems

Moderated usability testing
We went through the app and feedback analysis and found a lot of assumptions and insights on what users' pain points might be. This meant we could be more precise when creating usability testing.
Our moderated usability testing was conducted with 5 respondents. It included 7 main tasks, each of which consisted of several subtasks covering all the flows we wanted to check.
We included the CSAT, NPS, and SUS questionnaires, as well as simple questions about users' opinions or their difficulties with using the app. We didn’t want to overwhelm our users, so the estimated time for each study was 30 minutes.

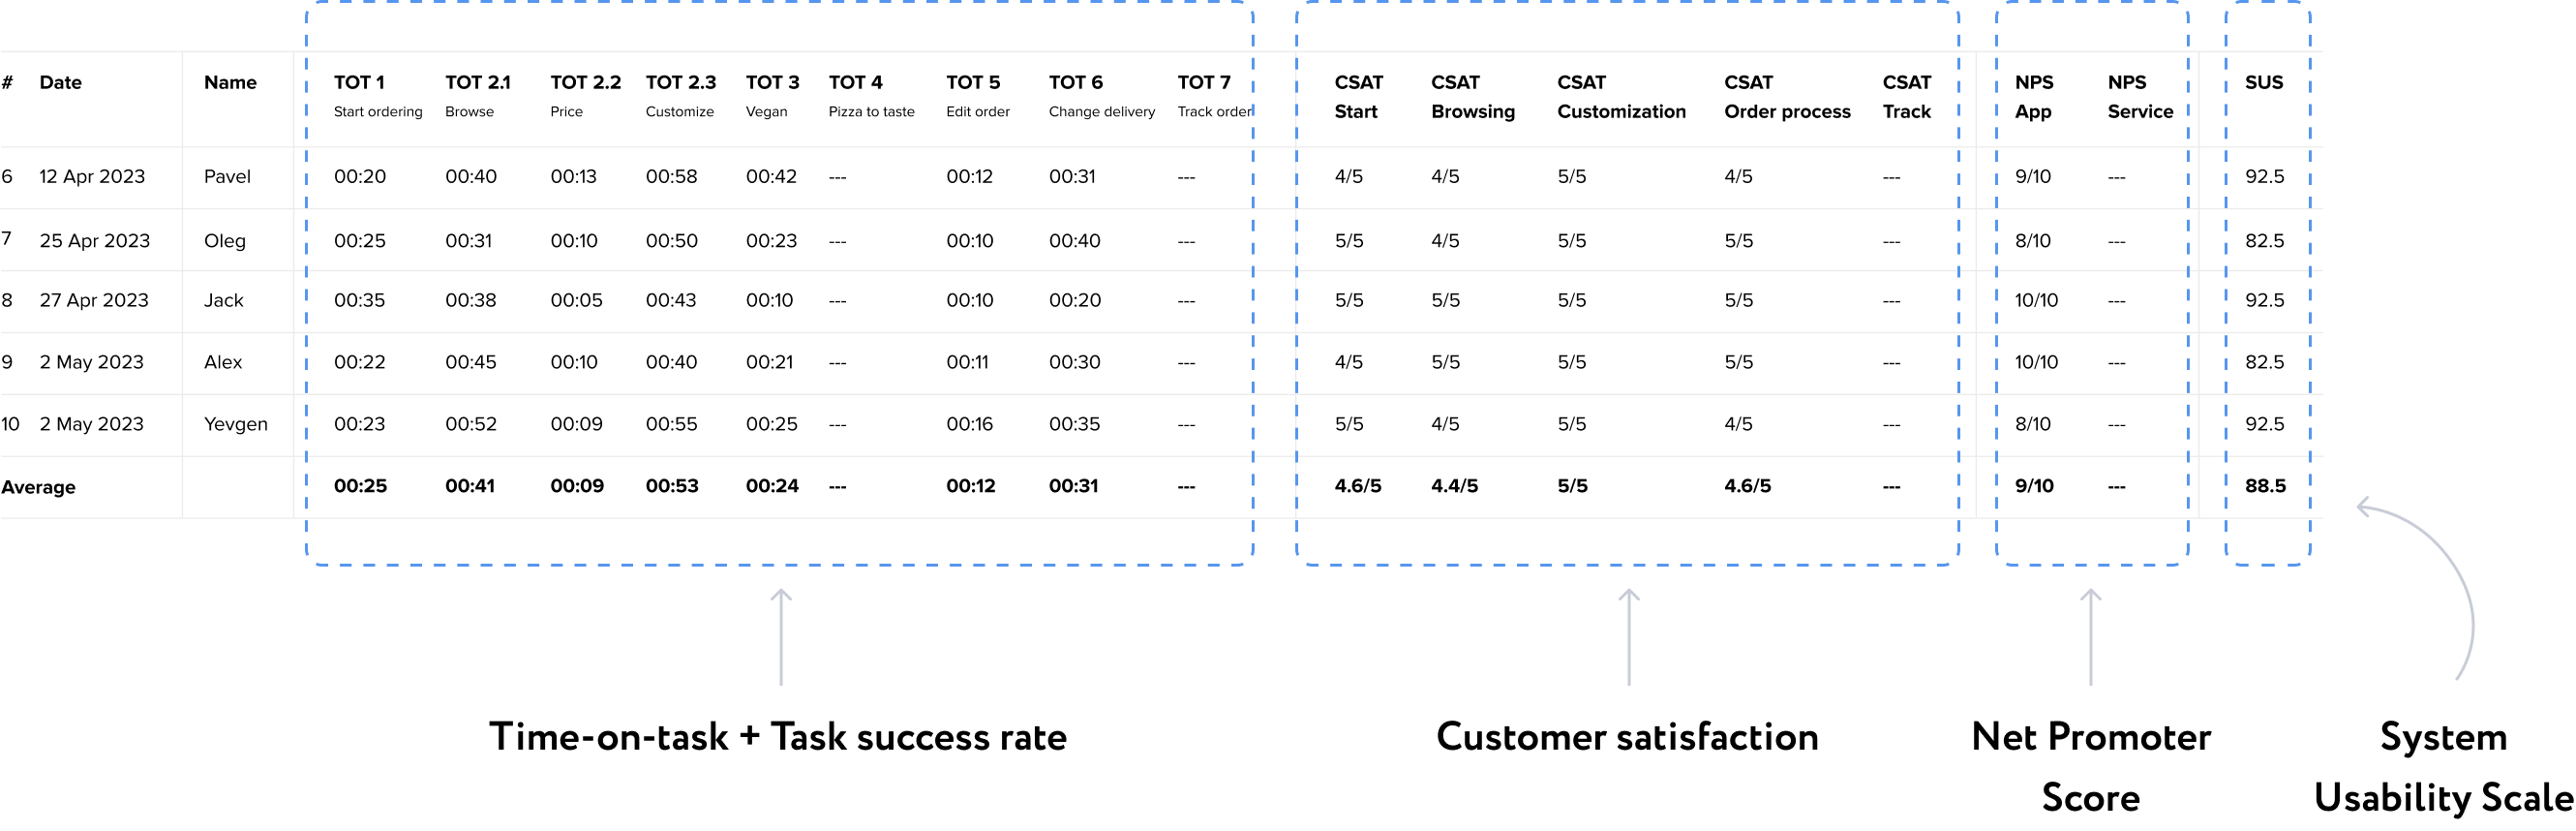
Usability testing results
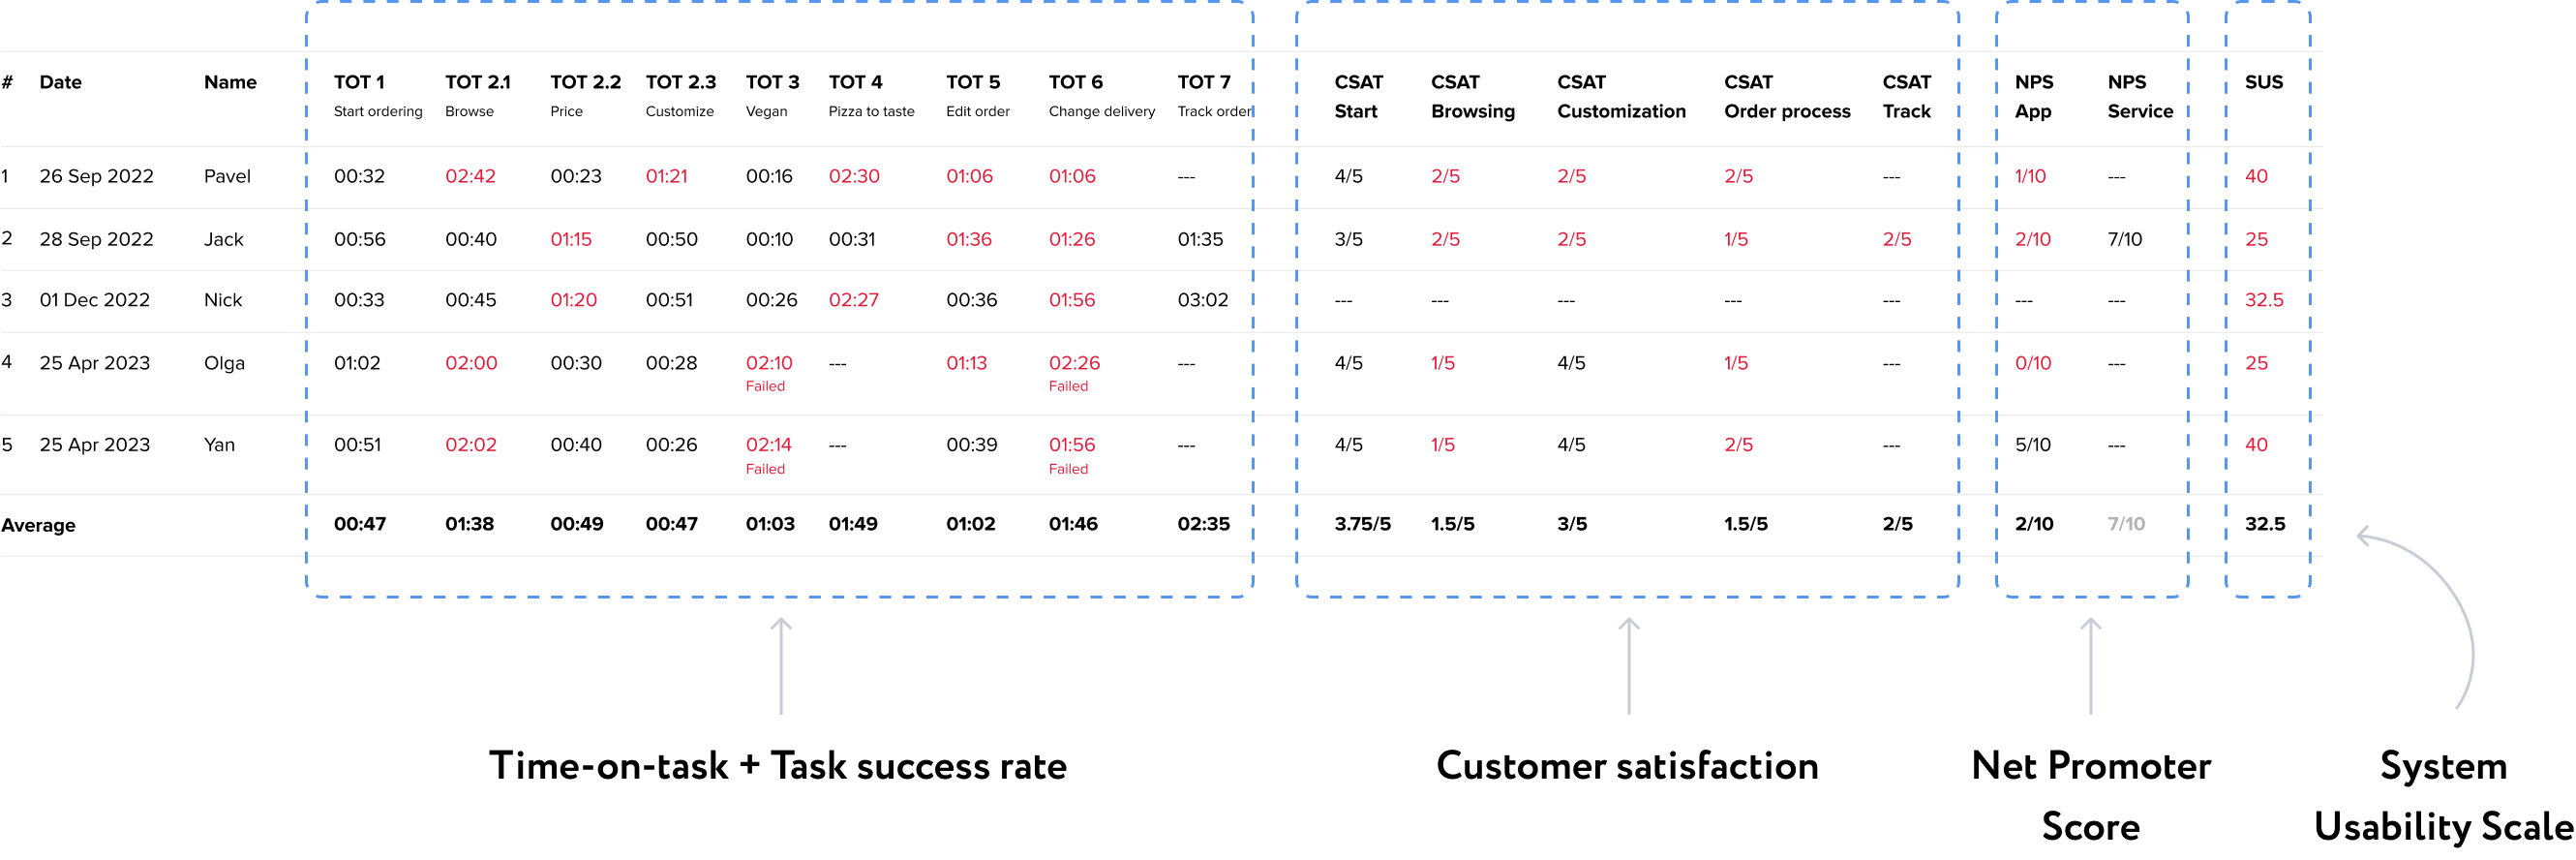
Here are the first usability testing results. What does this data mean? Is the current app that bad or not? We confirmed our assumption that all flows are difficult for users.
Let’s see what the figures tell us.
The most unsuccessful tasks:
1.Task 3: Find Vegan pizza
Time on Task: 01:03
CSAT: 01:03
Task success rate: 60%
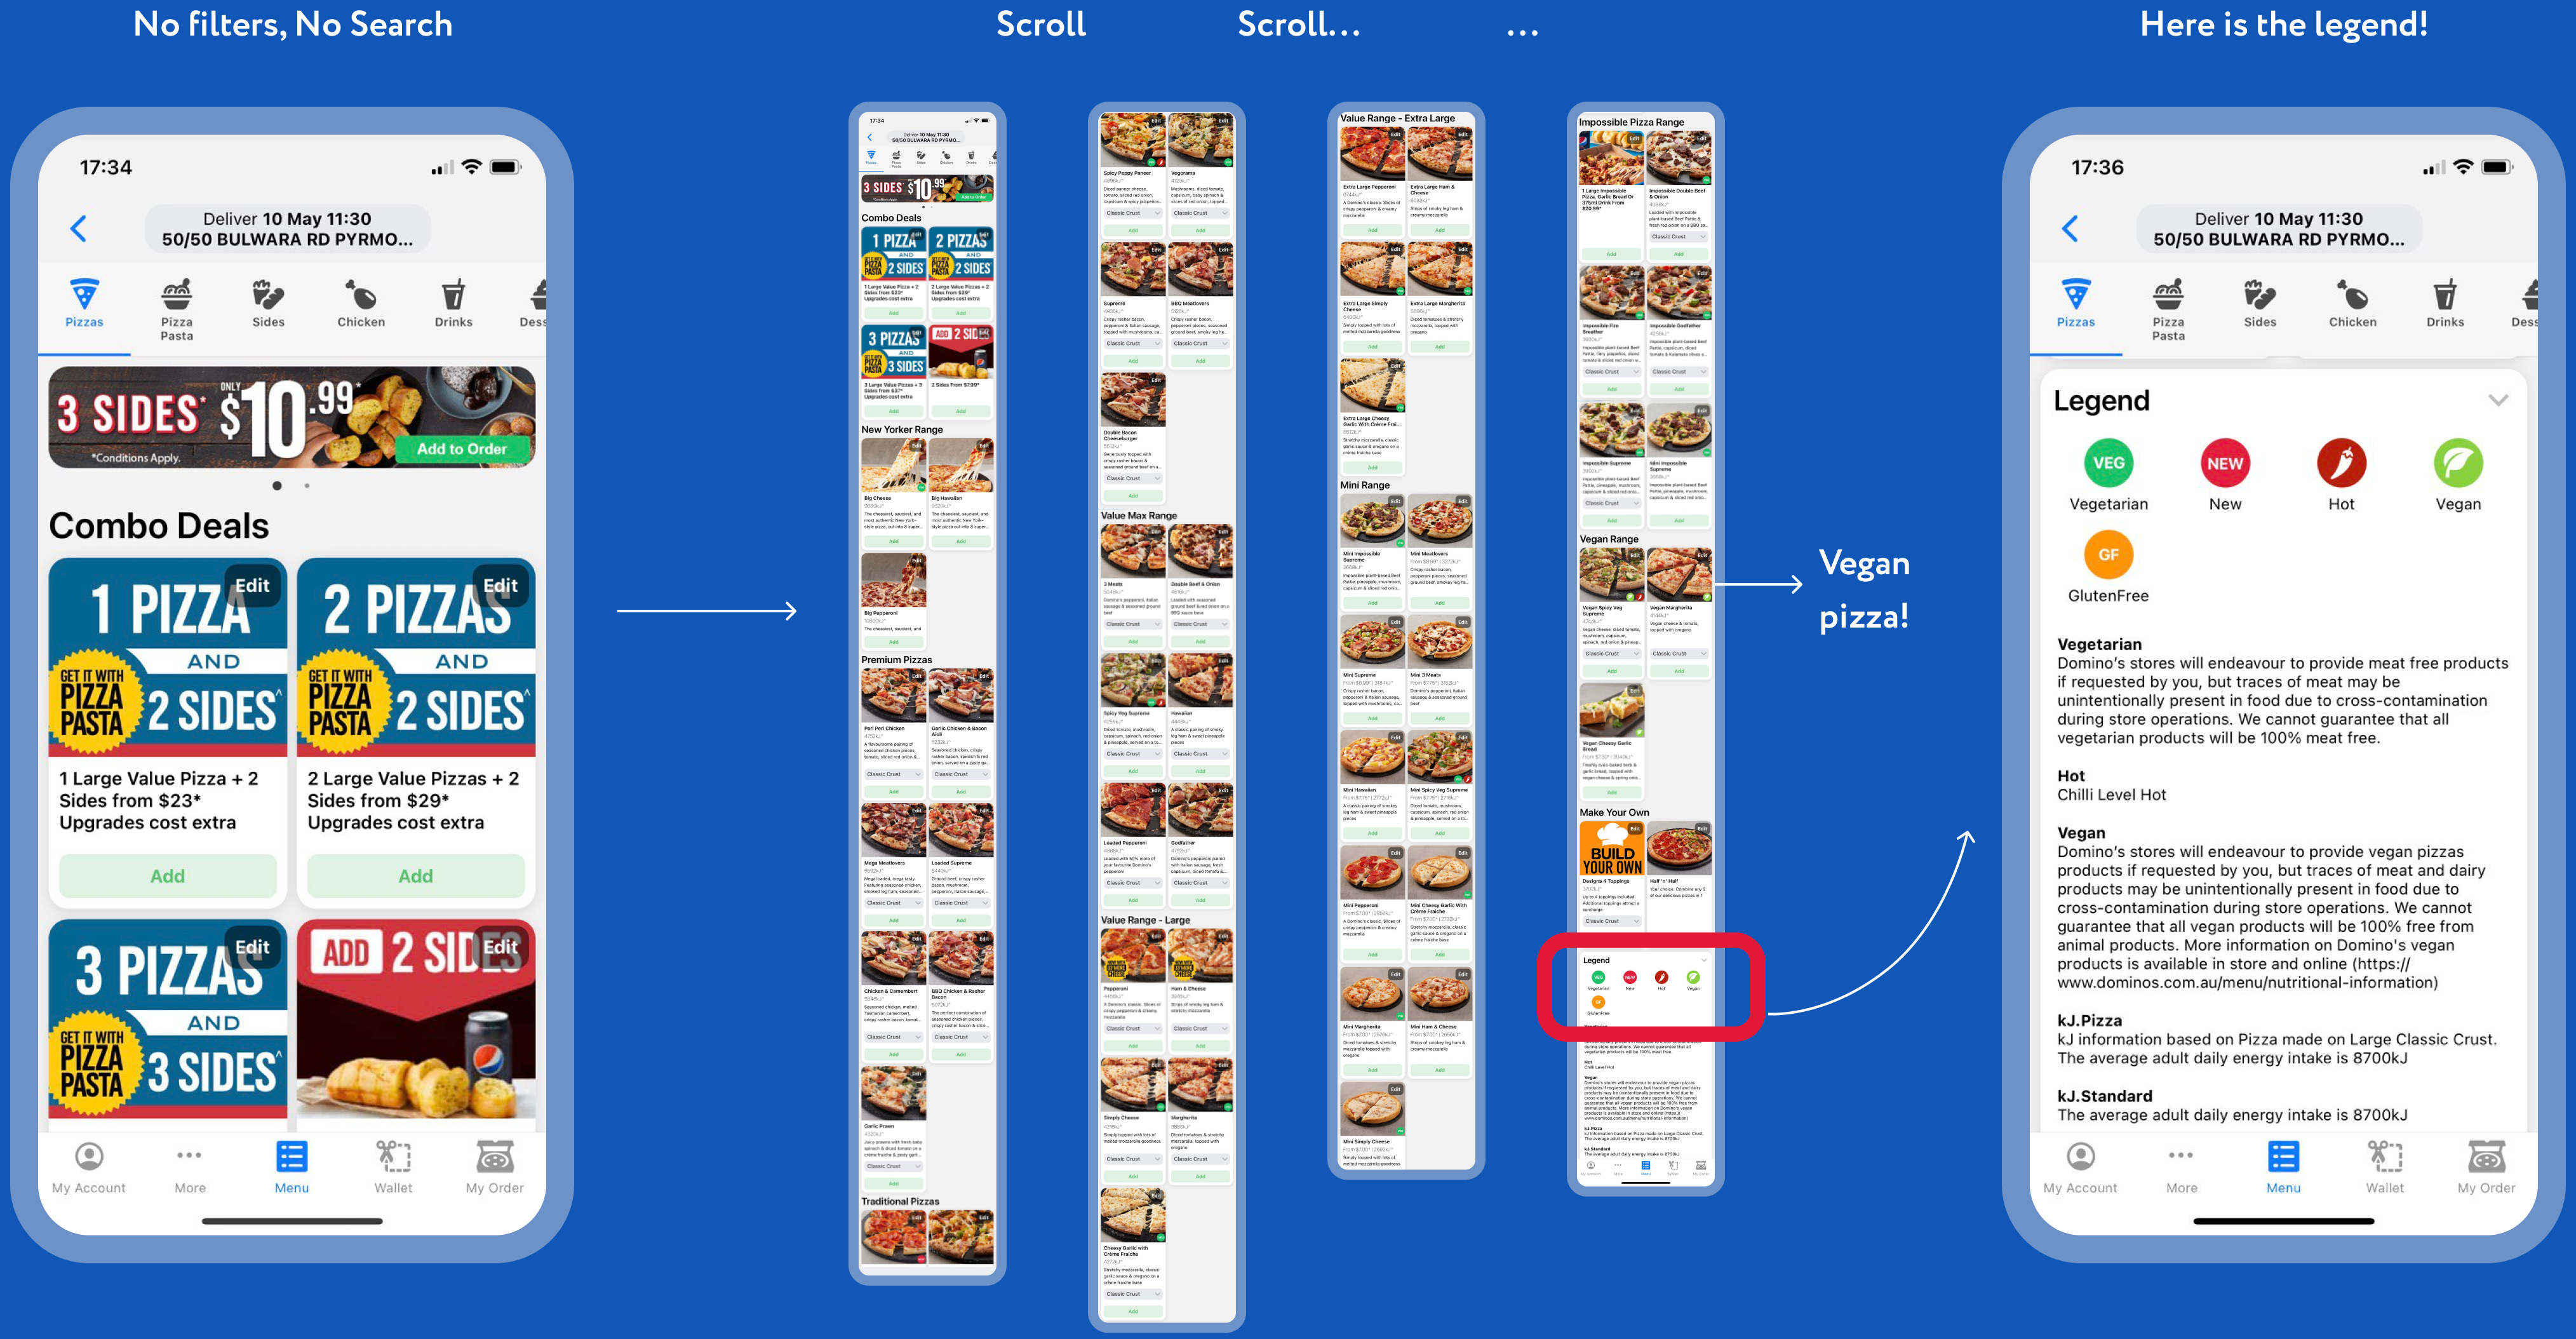
Two of 5 users couldn’t complete the task successfully, and all 5 users were confused by label naming. The app doesn’t have filters, sorting options, or any other opportunity to search. There are more than 50 pizza items, and the only way to find the pizza is you want is to scroll.

2.Task 2.2: Find Pizza’s price
Time on Task: 00:49
CSAT: 00:49
One is most annoying features of the app was difficulty with finding the pizza price. There is no way to find it except for going to Shopping cart.
3.Task 6: Change delivery options from the cart
Time on Task: 01:46
CSAT: 01:46
Task success rate: 60%
The winner is the flow where user wanted to change the delivery address. Lets imagine that you are ready to place the order and realized that the delivery address is not correct, how hard it could be to change it?


The field with delivery time and address are surprisingly inaccessible. Two out of 5 users gave up trying to change the address, the rest found that it took 5 steps to complete this simple action by pressing the back button.


Disappointed Nick, interviewee 3 during the first Usability testing
Discover result
The discover stage is over, here are the results:
- we proved that users have difficulties using the Domino’s Pizza mobile app
- we collected metrics we can compare with the final metrics
- we confirmed and collected a list of assumptions
- we found new insights and assumptions after user feedback analysis and moderated usability testing
Step 3. Define
Goal clarifying
Improve the user experience of the Domino’s app (5 flows), and measure our impact based on the following metrics:


Target audience & validated personas
Based on user research and secondary research (usability testing, App Store reviews, and open source data) we created 3 validated personas. They help us empathise with our users better and keep in mind their differences in behaviours and needs.
Ivan
Motivation
Ivan loves pizza and from time to time orders it using different apps, doesn’t have favourite pizza & service. Uses the apps to check out if he will be attracted by some pizza and order it. Uses a delivery option instead of pick up.
Pain
Can’t realise what he wants because of difficulties to find size/price/ingredients/delivery time. Feel annoyed because of a long process of ordering.
Solution
Use attractive pictures to motivate him to order.
Clearly show the price, size and delivery time.
Simplify the onboarding and order process to make him loyal to app.
Kevin
Familiar user. Product manager with middle income.
Motivation
He has his favorite Domino’s pizza and orders it 1-2 times a month. Sometimes can buy the new one to try.
Pain
He wants to reorder his favorite customized pizza, but there is no way to repeat the previous orders. He feels annoyed customizing the pizza because of jumping/moving rows.
Solution
Add the personalized section with his previous orders.
Add recommendations to engage him to try a new one.
Change UX of customization.
Lisa
Rare user. Eats only vegan pizzas, cares about her weight. Lower middle income.
Motivation
She can join her friends when they order Domino’s. Carefully check the ingredients, allergens, calories of pizza before ordering.
Pain
It’s very difficult to find appropriate pizza because of no search/filtering options. Allergen, nutritional information is hard to find and understand.
Solution
Add sorting feature to catalog.
Make the allergen/nutrition info more clear.
User story mapping
We created user story mapping for a visual representation of our mobile app features, and to make sure that the most important data from user testing was taken into account. It also helped us ensure we thought about all the needed steps in the user journey.
Step 4. Ideate
In this stage, we had to generate as many ideas as possible. We based it on our list of confirmed assumptions and a competitive audit to find the best UX practices and how we can stand out from competitors.
Competitive audit
For our competitive audit, we analysed:
- Domino’s main direct competitors in Australia: Zomato, Crust Pizza, Papa John’s, DoorDash, Deliveroo, Foodpanda, and UberEats (August 2022)
- Indirect competitors also can be included (food delivery, other delivery apps, and websites)
- Domino’s Pizza mobile apps in other countries. They all have different UI and UX, which could be useful for identifying best practices
Step 5. Prototyping & test
Wireframes
We created wireframes covering all 5 streams and interactions between these. For multiple screens, we created more than one variation.
The next step was to create the visual part of the design and test those variations to find out which UI or UX would be better and clearer for our users.
The most important problems and how we solved them
- Unattractive images
- Too long from the app’s launch to its catalogue
- No filters, no search, a confusing main page
- No personalisation, no repeat order feature
- Confusing, unhelpful customisation process, and too many non-categorised toppings with names that moved around on the screen
- Overcrowded product cards, no price information
- Difficulties changing delivery 📦 options
- No customer service or help
How AI helped us to make pizza pictures more attractive
Three of 5 respondents complained about unattractive pizza images. They said the images don’t make them want to taste the pizza immediately. Of course, a poor visual experience and inconsistency can affect customer loyalty and whether they return, and even whether they place an order or not.

Are AI tools able to help us with it? We tried the 2 most popular services: DALL·E and Midjourney. The good thing about Domino’s Pizza is that they use detailed pizza descriptions, so we can use them for AI prompts. After a few experiments, we decided to stay with the prompt with the following structure:
Full round photorealistic Domino’s pizza on white background. Diced paneer cheese, cherry tomatoes, red onion, capsicum and spicy tikka jalapeno drizzled with peri peri sauce
DALL-E


Midjourney


We decided to stay with Midjourney as it produced more attractive and realistic images. We created more than 50 visually appealing, photorealistic, and consistent images that match the pizzas’ descriptions.
Looking ahead, we haven't received any complaints about the images. During the final usability testing, no one noticed they were not real pizzas.
Main page
The key things we did for the main screen:
- Generated more attractive images
- Added an opportunity for users to repeat previous orders
- Made the field with delivery options on the top of the app tappable

Adding filters & improving navigation
Not being able to find things in an app without scrolling is frustrating. It’s one of the most annoying things about the current Domino's application.
People may want to find a particular pizza they’ve tried before. They may also want to find a small or large pizza or a vegan or vegetarian pizza. However, all of these tasks were difficult to accomplish. There is no option but to scroll through all the pizzas.
So, we analysed what criteria we could use for sorting. There are 4 main categories for filtering: basic filters, ranges, price, and size.
Main filters
New
Hot
Vegetarian
Vegan
Gluten free
Ranges
New Yorker Range
Premium Pizza
Traditional Pizza
Value Max Range
Value Range - Large
Value Range - Extra Large
Value Range - Mini
Impossible Pizza Range
Vegan Range
Price
Below $10
$10-20
$20 and higher
Size
Mini 17 cm (4 Slices)
Small 20 cm (8 Slices)
Medium 25 cm (8 Slices)
Large 30 cm (8 Slices)
Extra Large 32 cm (8 Slices)
Browsing & cards
- We simplified the cards by removing unnecessary options such as editing, adding, and customising the card internally since no one was using them during our first usability testing
- We added an animation effect when opening a pizza


Pizza description & customisation
Here's one of our ideas for what the setup process might look like if we didn't have any technical constraints.
Let’s show you our improvements!
- The pizza image is improved
- The pizza description is displayed in full
- A crust image has been added to make this feature more interesting and visible
- ‘Nutrition and Allergens’ was a link, but it looked like a dropdown menu, so we fixed it
- Added a price to the button to make it visible
- Tags were added so they only show up in the catalogue
- A ‘Favourites’ icon was added to help users save the most interesting items. It can also get them to sign in or sign up

Start ordering
We reduced the number of steps after the app launched. Also, address tooltips were added, so the user doesn’t have to type their full address. Now users also have an opportunity to edit or delete saved addresses.
Change delivery options
We simplified the interactions inside the shopping cart and the process to change delivery options.
Find specific pizza
One of the tasks in both usability tests was to find any vegan pizza. Two out of 5 people failed this task, confusing vegan pizza with vegetarian. The average time for this task was 63 seconds. By adding filters, we reduced the task execution time to 12 seconds with a success rate of 100%.
Step 6. Validation
Finally, we’ve reached the most interesting part!
For the validation stage, we created an interactive prototype covering all the necessary flows, created a new usability test, found 5 more respondents, and assigned them the same tasks.
Here is the final metric table. Let’s look at our goals:


As you can see, we significantly improved all metrics except for the time-on-task metric for Task 2.2 - Customisation. The time for this task increased by 12%.
What was the task exactly?
We asked users to customise the pizza by adding 2 toppings: cherry tomatoes
and prawns.
Let’s look at the Domino’s Pizza app:


Here is a very long, uncategorised list of toppings. During the first usability testing, users complained that it was hard to read the long toppings titles, all written in capitals and moving on the screen. Also, they were annoyed by jumping to the top toppings after selecting one. But all users completed the task successfully and the average time was 47 seconds.
And now let’s look at our wireframes.
Here are 3 options for the customisation screen.
Option 1: Toppings in alphabetical order.
Option 2: Toppings divided into categories.
Option 3: Similar to 2, but the categories are hidden under dropdowns. We separated
40 toppings into 4 categories: Fruit & Vegetables, Meat & Seafood, Cheese,
and Sauce. In our opinion, it was a perfect solution because it could reduce
the time spent searching for a particular topping.


We demonstrated these options to our potential users and asked them which option they found more convenient and understandable. All of them said they prefer the third option because they don’t need to scroll through a huge topping list like the current app presents.
But the numbers tell us otherwise. Why?


We have 4 guesses why:
- wireframes don't seem ideal for user testing. It's preferable to test high-fidelity design screens. This help users see exactly what the design will look like and give more accurate answers
- don't ask hypothetical questions like, "What do you think would be the best option for you?" Use A/B testing and track metrics (success rate, time on task, any feedback)
- the current Domino’s application only has 1 unnecessary dropdown list, while we have 4, and the user might have trouble with the category names and have to open each one
- all toppings in the current Domino’s application have images that can help users find a particular topping faster.
Conclusions
- We conducted an extensive review of the initial metrics, including 5 Key Performance Indicators (KPIs) that formed the basis of our new design.
- We conducted user testing with a diverse group of 5 participants, measuring a series of final metrics such as task success rate, time-on-task, customer satisfaction (CSAT), system usability scale (SUS), and net promoter score (NPS) to comprehensively assess the impact and success of our decisions.
- Our efforts led to significant achievements, meeting or exceeding the intended goals for 5 indicators. Although one metric fell short of expectations, we conducted a thorough analysis to identify reasons, such as being more specific when asking open-ended questions and relying on facts rather than hypothetical opinions, and found room for further improvement.
- Contrary to initial expectations, our research showed that designs that seemed less attractive actually demonstrated better functionality and performance. The time to complete one of the tasks increased by 12% compared to the previous design.
- Our study emphasised the importance of using objective facts and figures to guide decision-making processes. Using quantitative data and statistical analysis, we made the following improvements:
- time-on task metric score decreased from 58% to 82% for 5 tasks
- task success rate score increased from 60% to 100% for all 6 tasks
- SUS score increased from 32.5 to 88.6 with a sufficient value of 68
- NPS score increased from 2 to 9 with a sufficient value of 7
- customer satisfaction score increased from 1.5-3.5 to 4.4-5 depending on the task.