More effort took Opus 5 from 70% to 7%

CTO of MadAppGang
"Fix write-ahead-log crash recovery ordering" is one task in Terminal-Bench 3.0. At low effort, Opus 5 passed it 70% of the time. At top effort, it passed 7% of the time.
The model thought longer and got it wrong more often.
I've been saying this for a while, mostly to people who didn't want to hear it. In our evals at MadAppGang, lower effort beat higher effort on a set of tasks. The result was better, it came faster, and it cost less.
On 25 September Thariq Shihipar from Anthropic published Spending your effort on the claude.dev blog. He ran his own tests and went deep into Terminal-Bench 3.0 with per-task data. His results overlap with ours very closely. Most of the interesting data sits below the first chart, so that's where this post goes.
TL;DR: Higher effort raises Claude's average on Terminal-Bench 3.0. On specific tasks it goes the other way: at top effort Opus 5 passed one software task 7% of the time, down from 70% at low. Effort pays on security, hardware and edge-case work, and costs about three times the tokens on tasks the model already does well, so measure it per task on your own workflow.
The curve everyone believes
The article opens with the chart you have probably seen already. Terminal-Bench 3.0, 70 tasks, pass rate against tokens spent. Every model climbs as effort goes up.
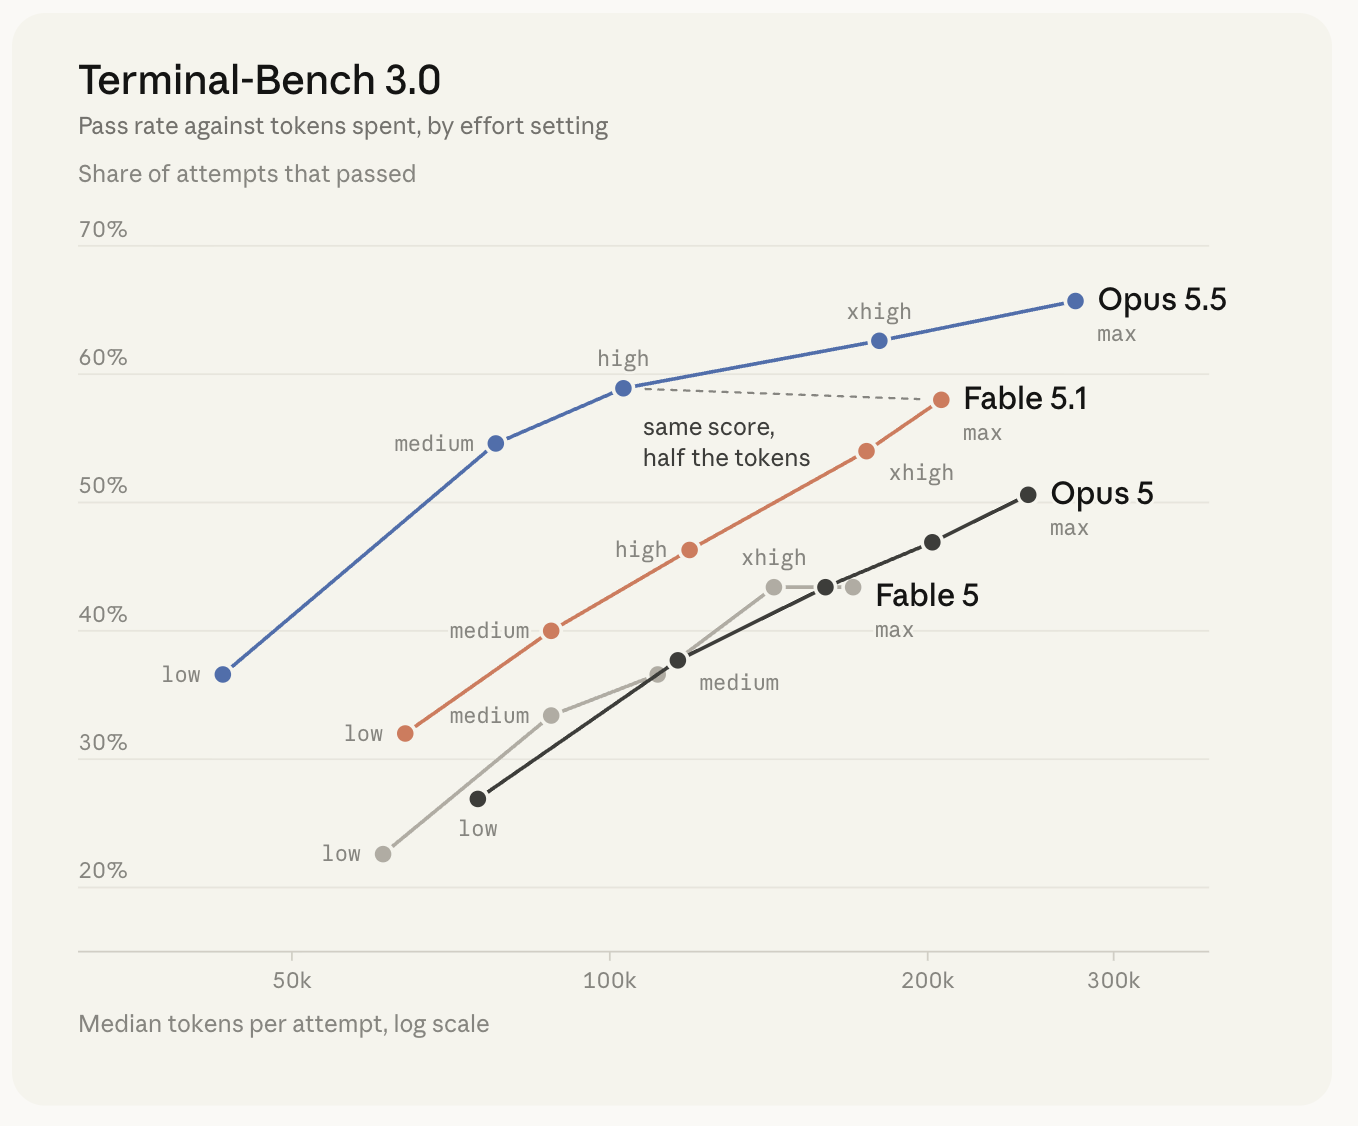
Opus 5.5 goes from about 37% at low to about 66% at max. Fable 5.1 goes from about 32% to about 58%. Opus 5.5 at high gets the same score as Fable 5.1 at max with half the tokens.
It's a good chart. It is also an average over 70 tasks.
Look at Fable 5 on the same chart. It scores about 43% at xhigh and about 43% at max. The line goes right and doesn't go up. You pay more tokens and get the same number.
An average is true for the whole pile. It tells you very little about the one task your agent runs every day. The good part of Thariq's article is that he doesn't stop at the curve. He opens it up by category and by task, and that's where our results and his start to match.
1. More effort made some tasks worse
I took two screenshots from the software category, 20 tasks, and highlighted the drops.
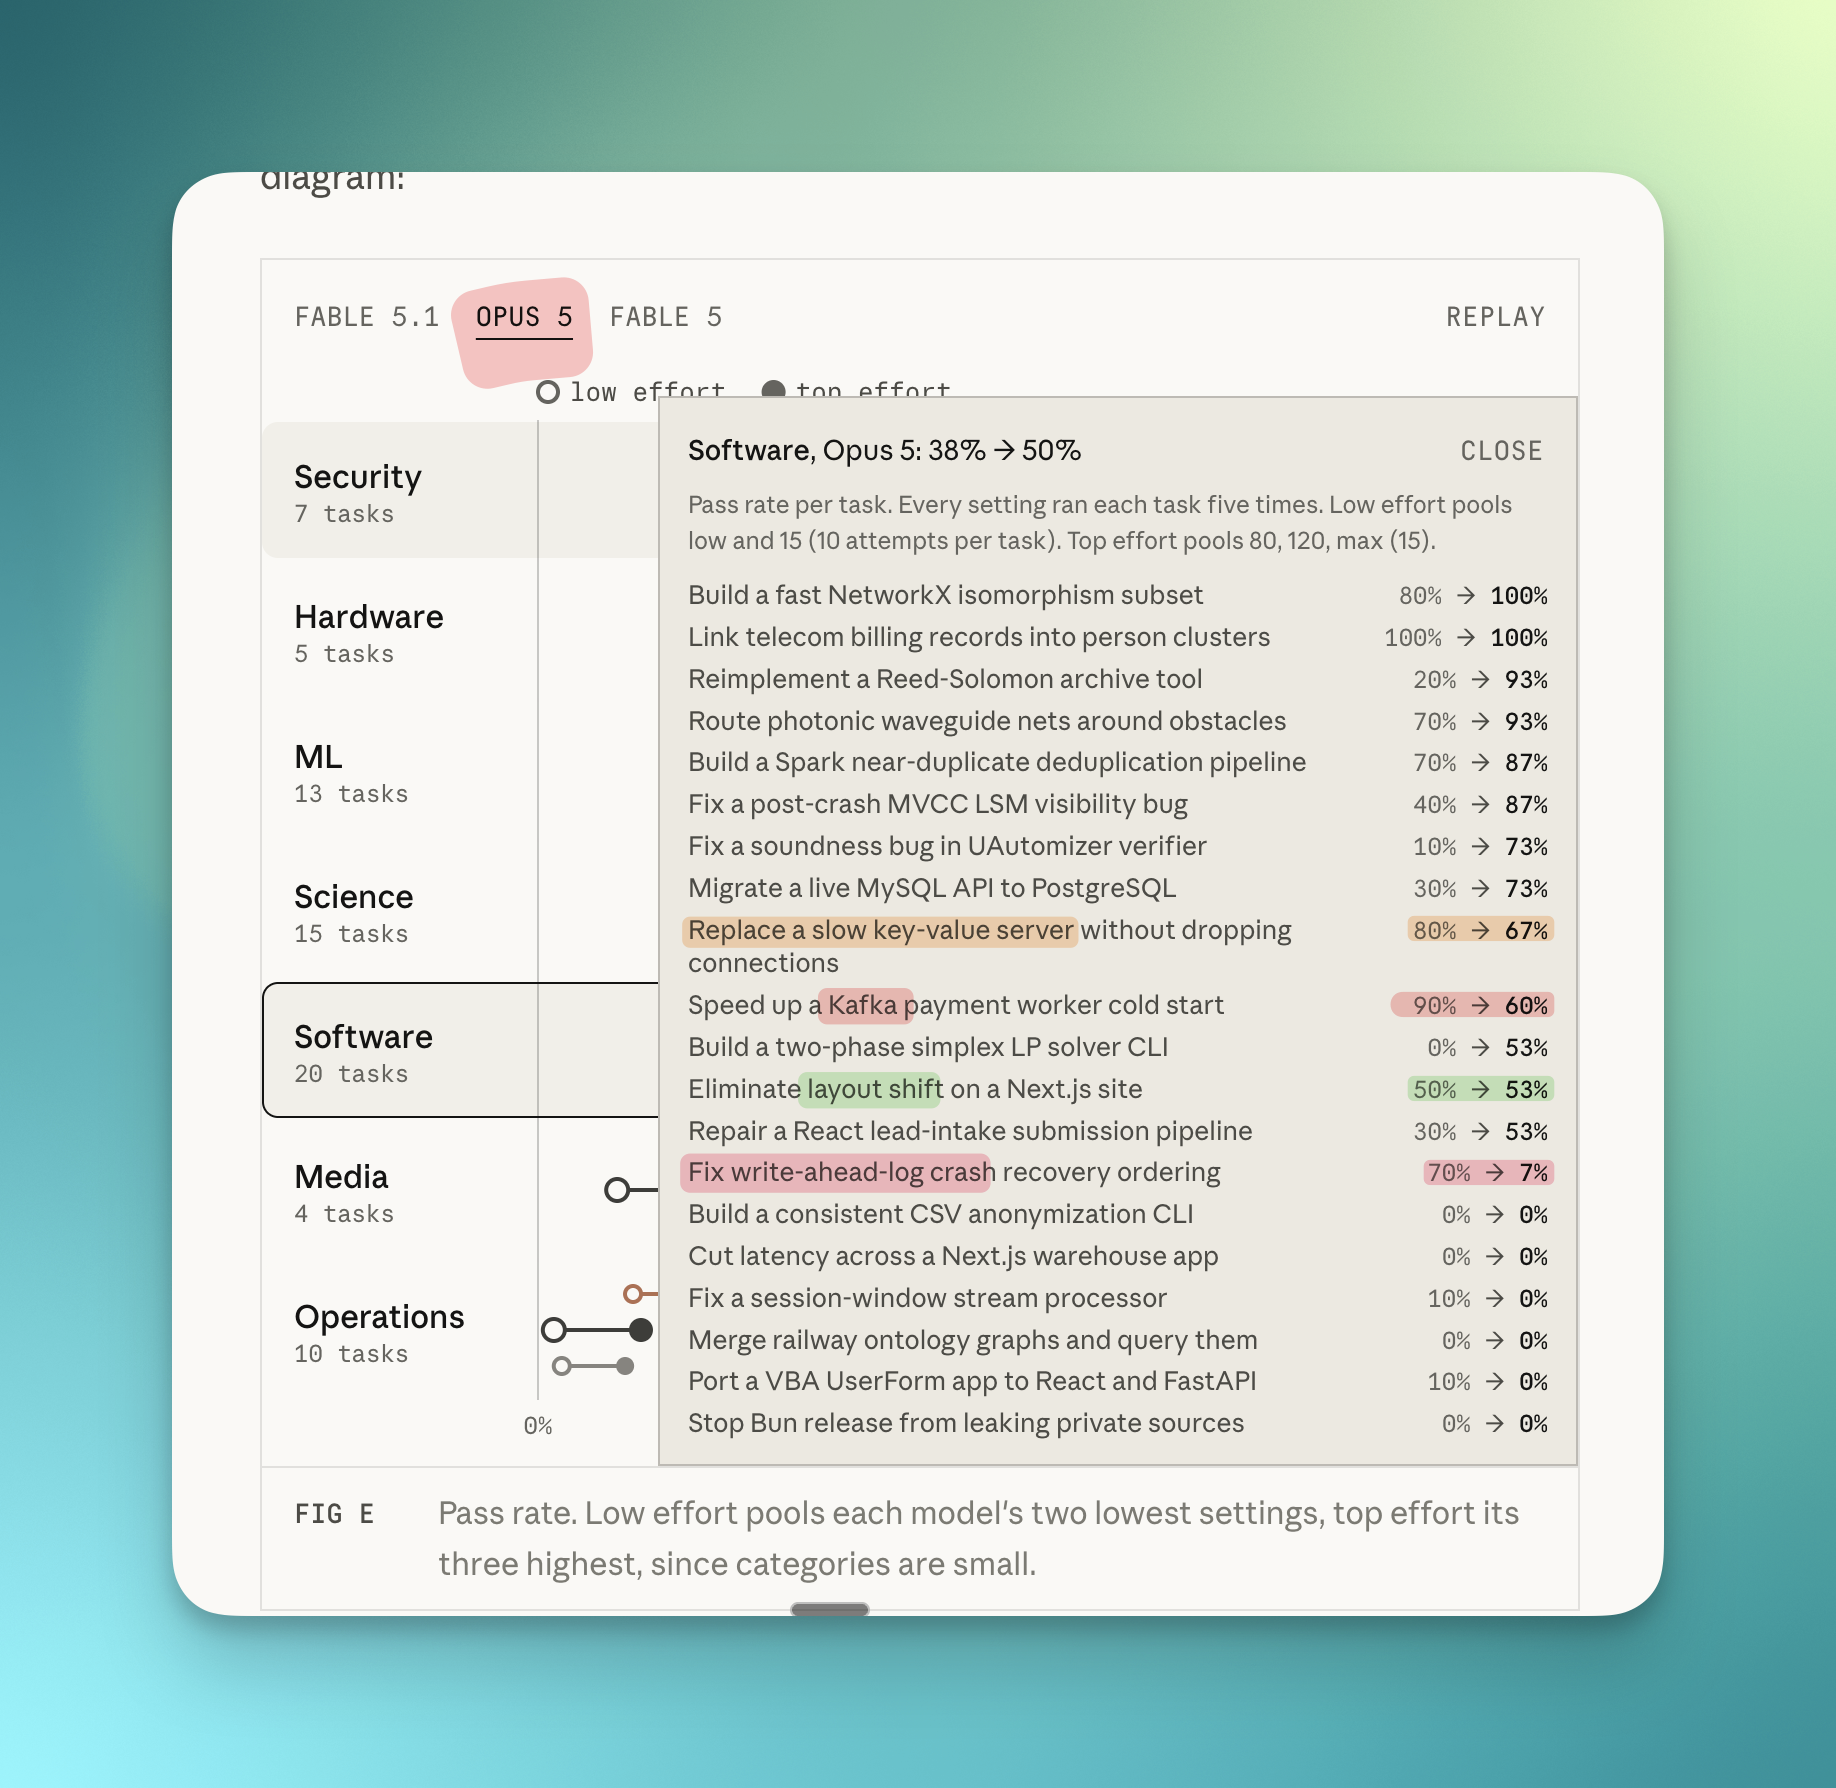
Opus 5 in software goes from 38% at low effort to 50% at top effort. That's a good average. Inside it, five tasks went down:
- Fix write-ahead-log crash recovery ordering: 70% to 7%
- Speed up a Kafka payment worker cold start: 90% to 60%
- Replace a slow key-value server without dropping connections: 80% to 67%
- Fix a session-window stream processor: 10% to 0%
- Port a VBA UserForm app to React and FastAPI: 10% to 0%
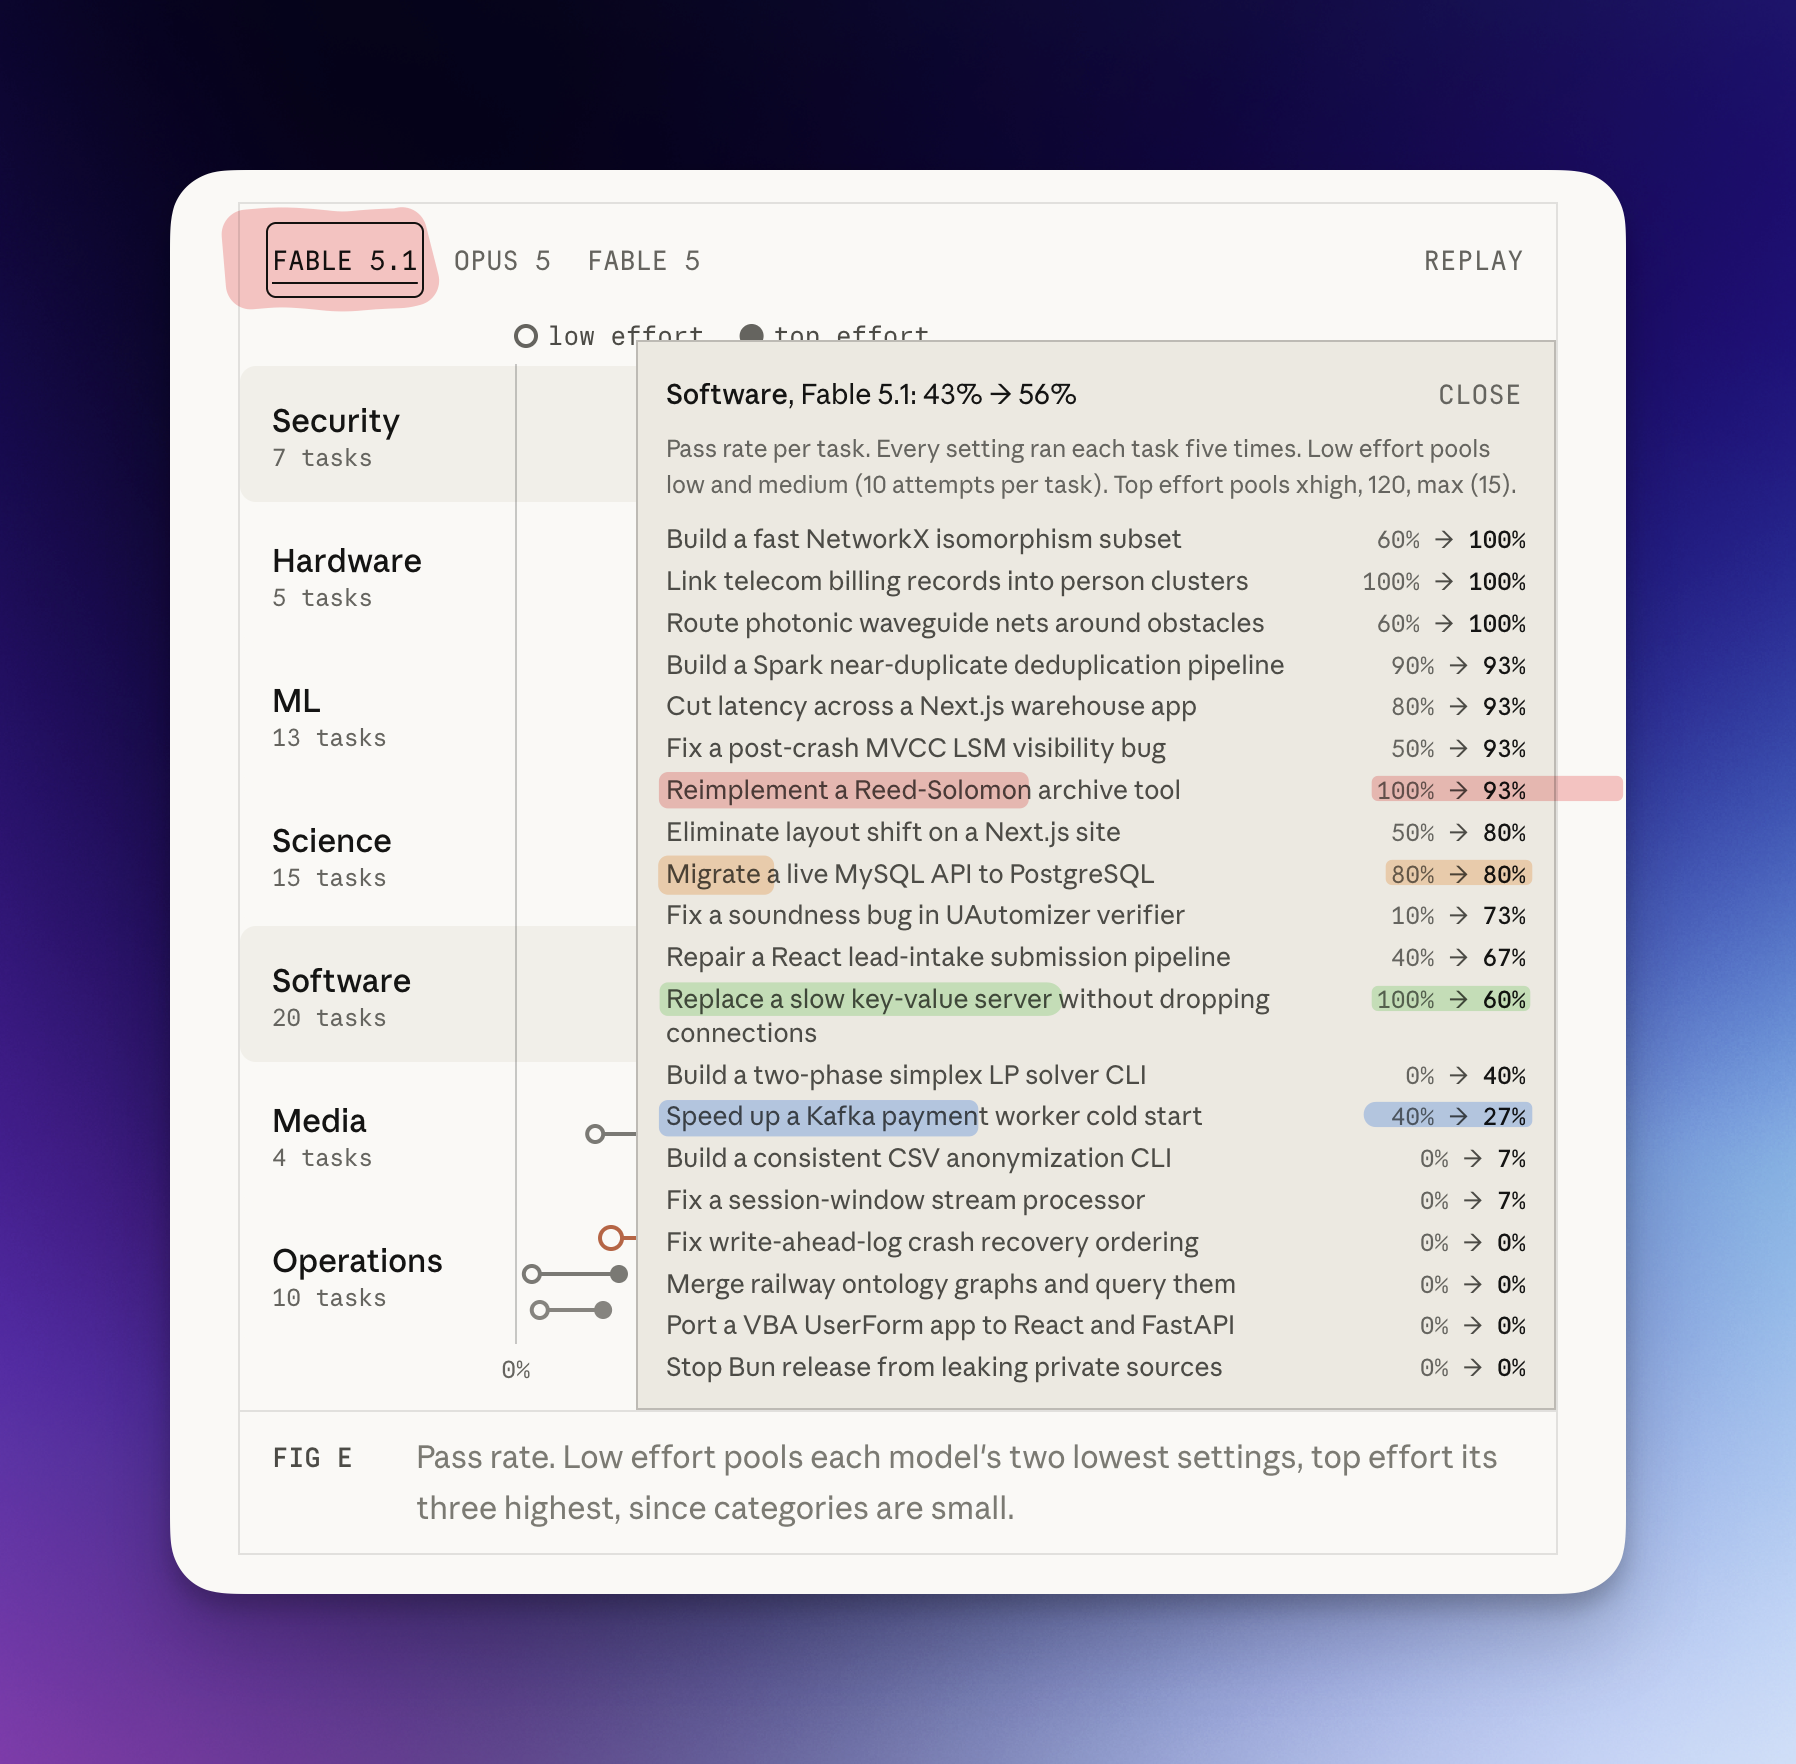
Fable 5.1 in software goes from 43% to 56%. Three tasks went down:
- Replace a slow key-value server without dropping connections: 100% to 60%
- Speed up a Kafka payment worker cold start: 40% to 27%
- Reimplement a Reed-Solomon archive tool: 100% to 93%
Now look at the tasks where both models got worse. There are exactly two: the key-value server and the Kafka worker. Both are "make it faster" tasks.
The harder both models thought about Kafka, the worse it went. To be fair, that's how Kafka works for people too.
This is the same area where we see degradation in our evals: optimization, performance and architecture work. These are the tasks where you have to understand the whole system before you touch one line of it. More thinking there doesn't help, and sometimes it makes things worse.
I don't have an explanation for why yet. I only have the overlap, and it is very close.
2. Legacy code is hard at every effort level
The VBA port is my favorite line in the whole table. Opus 5 went from 10% to 0%. Fable 5.1 was at 0% on low and stayed at 0% on top. Effort had nothing to work with.
Anyone who has opened a VBA project from 2006 will understand the model here.
Layout is weak too. Media, which includes rebuilding a poster as an editable layout file, is one of the lowest categories: 18% at low and 30% at top for Fable 5.1. On "eliminate layout shift on a Next.js site" Opus 5 went from 50% to 53%. To be precise, Fable 5.1 did better on that one, 50% to 80%, so I won't say every model is equally bad at layout. But when a model can't see the page well, thinking longer about the page doesn't fix much.
Operations looks the same, 12% to 22% on Fable 5.1. Thariq calls it "rulebook-style work". The model either knows the rules of that domain or it doesn't. Effort doesn't teach it the rules.
3. When the model already knows, effort is a bill
Fable 5.1 was at 100% on the key-value server at low effort. At top effort it was at 60%. It was at 100% on Reed-Solomon, then 93%. It was at 80% on the MySQL to PostgreSQL migration, and it stayed at 80%.
Meanwhile the median attempt went from about 73k tokens at low to about 222k tokens at max. That's about three times the tokens.
So for a task Fable 5.1 already does well, more effort costs about three times more for the same result, or a worse one.
Opus 5 is a different story. On some software tasks effort paid off in a big way:
- Reimplement a Reed-Solomon archive tool: 20% to 93%
- Fix a soundness bug in the UAutomizer verifier: 10% to 73%
- Build a two-phase simplex LP solver CLI: 0% to 53%
- Migrate a live MySQL API to PostgreSQL: 30% to 73%
- Fix a post-crash MVCC LSM visibility bug: 40% to 87%
This is one category on one benchmark with one setting changed. Five tasks gained more than 40 points each, and five tasks lost.
The real value is in the per-task view.
4. More effort means more of the model's own opinion
This is the part of Thariq's article I found most useful. He explains effort as how much independent action the model takes. At higher effort it does more verification and more edge-case testing, and it also uses more of its own judgement.
His failure breakdown shows both halves. For Fable 5.1 over 370 attempts, going from low to max:
- Failures from a missed edge case dropped from 59 to 24
- Failures from "picked the wrong reading" of the task rose from 25 to 47
The verification part fixes edge cases. The judgement part picks the wrong reading more often. You get both from one knob, and you can't buy one without the other.
It may be part of the answer for optimization tasks, where the model has to decide for itself what "faster" means. I can't prove that yet.
Where effort pays
"So should I just run everything on low, Jack?" you'll ask me. And it's a great question.
No. Thariq's category numbers are clear. Security goes from 64% to 87% with effort. Hardware goes from 34% to 75%. Software gets a solid gain on average, and in my experience it gains more when the tooling around the model lets it check its own work. His best example is the MVCC bug. At low effort Opus 5.5 edited the code before it even ran the reproducer, and it passed 0 of 5. At xhigh it reproduced the crash first, wrote a randomized test against a reference, and passed 4 of 5.
His rule of thumb is simple and I agree with it:
- Low for quick in-the-loop work: brainstorming, sketches, easy changes
- Medium for most regular software work
- High when verification matters or there are many edge cases
- Max when Claude works fully alone on a hard problem
And the loop he uses for features: let Claude interview you about the spec, implement on low, review, then verify and test on high.
My addition is about agents, not chat.
When you build an agentic workflow, treat effort as a parameter you measure, the same way you measure a model. Take 10 to 20 real tasks from your own area. Run them at low, medium and high. Look at pass rate and tokens per task, not the average. Then pick the effort per step.
The effort curve is true on average, and your workflow is a specific set of tasks. For some of them the curve goes the other way.
FAQ
Does higher effort make Claude better?
On average, yes. On Terminal-Bench 3.0 every model climbs as effort goes up. On specific tasks it can go the other way: on "Fix write-ahead-log crash recovery ordering" Opus 5 passed 70% of the time at low effort and 7% at top effort.
Which tasks get worse with more effort?
In the software category, the two tasks where both Opus 5 and Fable 5.1 got worse are "make it faster" tasks: a key-value server and a Kafka worker cold start. It's the same area where we see degradation in our evals: optimization, performance and architecture work.
Where does higher effort pay off?
Where verification matters or there are many edge cases. In Thariq's category numbers, security goes from 64% to 87% with effort and hardware goes from 34% to 75%.
How much more does max effort cost?
The median attempt went from about 73k tokens at low to about 222k tokens at max, about three times the tokens. On a task the model already does well, you pay that for the same result, or a worse one.
Which effort level should I use?
Thariq's rule of thumb: low for quick in-the-loop work, medium for most regular software work, high when verification matters or there are many edge cases, max when Claude works fully alone on a hard problem. For agents, take 10 to 20 real tasks from your own area, run them at low, medium and high, and pick the effort per step.
Data: Spending your effort by Thariq Shihipar, claude.dev blog, 25 Sep 2026. Terminal-Bench 3.0 internal runs, 5 attempts per task per setting. "Low" pools each model's two lowest settings and "top" its three highest. Task list: github.com/harbor-framework/terminal-bench. Highlights on the screenshots are mine.

